
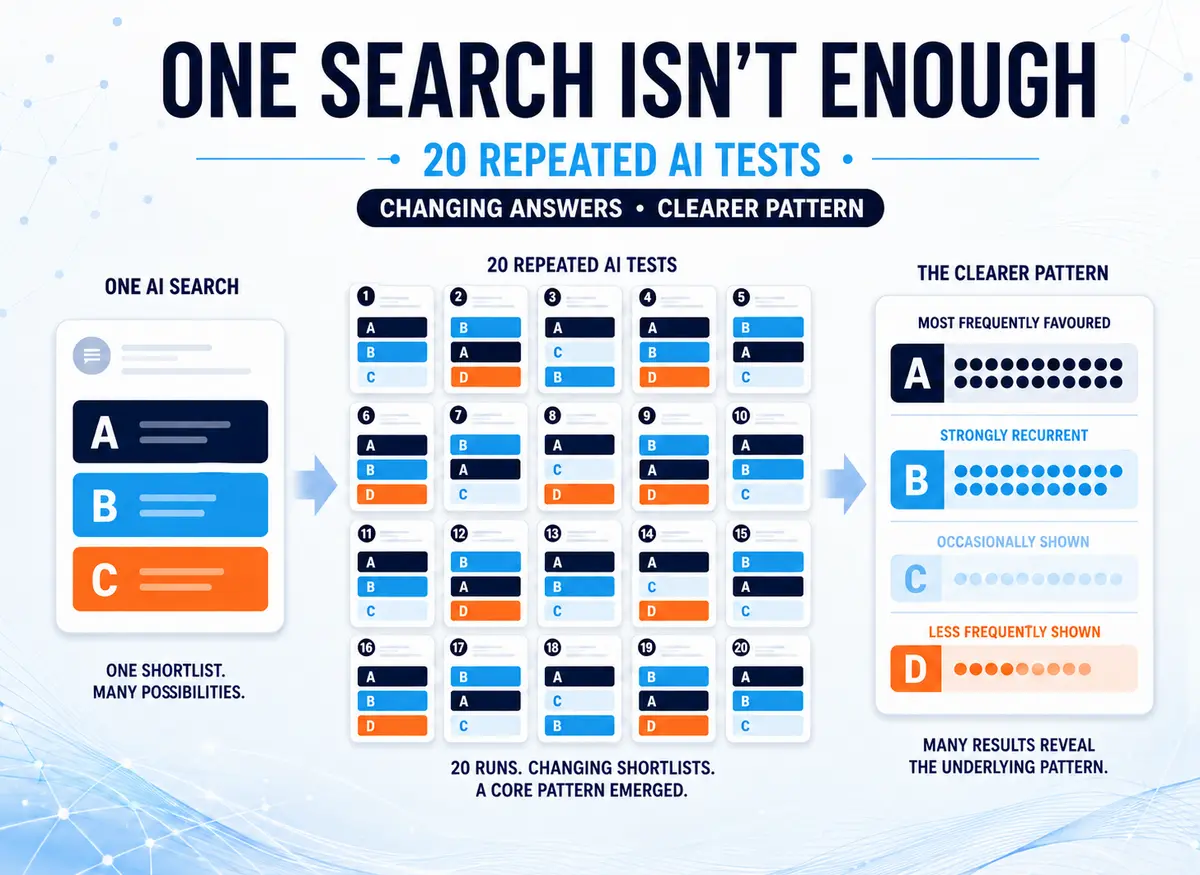
How many times must an AI search be repeated before a meaningful pattern becomes visible?
I expected it might require a large number of searches. AI-generated responses are organic, sources can change, and different products can move in and out of the recommendations.
In this limited experiment, however, a recognisable pattern emerged within just ten searches.
The individual shortlists continued to change, but a core group of favoured recommendations became visible surprisingly quickly. Extending the experiment to 20 runs uncovered two rarer alternatives, yet it did not overturn the hierarchy established during the first ten.
That leads to the central finding:
Repeated testing did not make the responses stop changing. It revealed the pattern hidden underneath those changes.
A single search showed one possible shortlist. Repeated searches showed which products Google AI Mode consistently favoured.
The original product search
I used the following prompt:
“I run a small UK marketing agency with eight employees. We need project management software that includes time tracking, allows clients to view project progress, integrates with Xero, and costs no more than £100 per month. Which three options should we shortlist, and why? Please present the 3 option shortlist as a table just with the recommended names.”
The prompt deliberately described a particular buying situation rather than asking broadly for the best project-management software.
It contained several constraints:
- a UK marketing agency;
- eight employees;
- time tracking;
- client progress visibility;
- Xero integration;
- a maximum cost of £100 per month;
- exactly three shortlisted products.
The first ten searches were conducted on 3 August 2026 over approximately one hour. I used the same Google account, personalisation was turned off, and the prompt remained unchanged.
I retained screenshots of the three-product shortlist from each response.
The results of those first ten searches are covered in my original experiment:
The Same Google AI Mode Product Search Run 10 Times
That experiment established that one search could not be treated as a fixed answer. This follow-up asked a different question:
Would additional searches produce an ever-expanding collection of products, or would the recommendations converge around a recognisable group?
A pattern appeared within ten searches
The first ten responses produced 30 available recommendation positions.
Six products occupied those positions:
| Product | Appearances in first 10 runs | Coverage |
|---|---|---|
| Teamwork | 10 | 100% |
| ClickUp | 7 | 70% |
| Xero Projects | 5 | 50% |
| Productive.io | 3 | 30% |
| Paymo | 3 | 30% |
| Avaza | 2 | 20% |
The exact shortlist and its order continued to change, but the emerging hierarchy was difficult to miss.
Teamwork appeared in every response. ClickUp appeared in seven. Xero Projects appeared in five, while the remaining three products rotated through a smaller number of positions.
That was faster than I expected.
Ten searches did not reveal every product that would eventually appear, but they were enough to separate:
- one persistent recommendation;
- one strong recurring recommendation;
- a middle group of alternatives.
Someone checking only once would not have seen this structure.
If the first response happened to place ClickUp first, the reasonable conclusion might have been that ClickUp had the strongest visibility. Only repeated testing showed that Teamwork was the more consistently selected product.
Extending the experiment to 20 runs
I then continued until I had collected 20 responses.
Twenty runs generated 60 recommendation positions. Eight different products appeared in total.
| Product | Appearances | Coverage | Share of recommendation positions |
|---|---|---|---|
| Teamwork | 20 | 100% | 33.3% |
| ClickUp | 12 | 60% | 20.0% |
| Xero Projects | 8 | 40% | 13.3% |
| Avaza | 8 | 40% | 13.3% |
| Paymo | 6 | 30% | 10.0% |
| Productive.io | 4 | 20% | 6.7% |
| Zoho Projects | 1 | 5% | 1.7% |
| Plutio | 1 | 5% | 1.7% |
Coverage measures the percentage of responses in which a product appeared.
Share of recommendation positions measures how many of the 60 available shortlist places each product occupied.
Because Teamwork appeared exactly once in every response, it accounted for one-third of all available recommendation positions.
Most of the pool was discovered quickly
The number of unique products initially increased rapidly:
| Runs completed | Unique products discovered |
|---|---|
| 1 | 3 |
| 2 | 3 |
| 3 | 5 |
| 5 | 6 |
| 10 | 6 |
| 12 | 7 |
| 13 | 8 |
| 20 | 8 |
The first response introduced Teamwork, ClickUp and Xero Projects.
Productive.io and Paymo had appeared by run three. Avaza joined the pool in run five.
No further product appeared during runs six to eleven. Zoho Projects then appeared once in run twelve, followed by one appearance from Plutio in run thirteen.
No new product appeared during the final seven runs.
This does not prove that an additional product could never appear in a larger experiment. It does suggest that the rate of new discovery was declining and that the recommendation pool was approaching a plateau.
The core pattern was visible after ten searches. The second ten revealed more about its edges.
The responses did not stabilise—but the distribution began to
It would be misleading to say that the AI answers became stable.
Products continued to:
- enter and leave the shortlist;
- move between first, second and third;
- appear alongside different competitors;
- receive different descriptions;
- be supported by different sources.
However, previously seen combinations also began repeating.
The following shortlist appeared three times in exactly the same order:
- Xero Projects
- Teamwork
- Avaza
Another combination appeared twice in this order:
- Teamwork
- Paymo
- ClickUp
Those three products later appeared together again, but with ClickUp moved into first place.
The clearest description is therefore:
The responses did not stabilise, but the distribution behind them began to look increasingly stable.
Google AI Mode appeared to be selecting from a weighted candidate pool. Some products had a much greater probability of inclusion than others.
Coverage and position revealed different patterns
A product’s inclusion and its position are separate measurements.
Teamwork’s 20 appearances were distributed as follows:
| Position | Appearances |
|---|---|
| First | 9 |
| Second | 9 |
| Third | 2 |
Teamwork had perfect coverage, but it was not always ranked first.
ClickUp appeared in only 12 responses but sometimes occupied first place. Xero Projects appeared eight times and was the leading recommendation in five of those responses.
Someone looking at one result could therefore receive a very different impression from the pattern shown by all 20.
Useful AI visibility measurements may include:
- coverage across repeated searches;
- total share of recommendation positions;
- average recommendation position;
- frequency of first-place recommendations;
- recurring competitors;
- rare entrants into the candidate pool.
One response cannot provide those measurements.
Why did a pattern emerge so quickly?
A broad search for the best project-management software could potentially draw from a large market.
This prompt was much more restrictive.
Each requirement narrowed the field:
| Requirement | How it restricted the likely pool |
|---|---|
| Eight employees | Required affordable access for a complete team |
| £100 monthly limit | Excluded more expensive agency platforms |
| Time tracking | Excluded tools requiring separate tracking software |
| Client visibility | Favoured client-facing platforms |
| Xero integration | Removed many otherwise suitable products |
| Three recommendations | Forced AI Mode to prioritise a shortlist |
The intersection of those requirements may genuinely contain only a relatively small number of plausible products.
Teamwork’s 100% coverage is understandable because it is positioned around client-facing agency work, time tracking and integrations.
The surprising finding is not that any products repeated. It is that only a modest number of searches exposed such a clear distinction between persistent, recurring and rare recommendations.
This may not happen as quickly with every prompt.
A broader query could produce a larger, less settled candidate pool. A highly specialised query with only two or three credible suppliers might converge even faster.
The speed at which a pattern emerges is therefore likely to depend on how specific the buying situation is and how many genuine alternatives exist.
The AI recommendation pool may be larger than the qualifying pool
Eight products appeared during the experiment. That does not prove that all eight fully met every condition.
AI Mode sometimes appeared to relax or reinterpret a requirement.
Xero Projects and client visibility
Xero Projects clearly provides project time and cost tracking within Xero. It can also support eight users within the relevant subscription.
The difficulty was the client-visibility requirement.
Some responses acknowledged that Xero Projects lacked a conventional client portal but substituted:
- progress invoices;
- financial reports;
- project summaries;
- supposed interactive project links.
Sending an invoice or cost report is not necessarily equivalent to giving a client access to tasks, milestones and project progress.
Several responses also quoted outdated Xero prices. The current UK pricing page listed Ultimate at £65 per month excluding VAT when checked, rather than the £59 quoted in the final response.
Avaza’s plan calculation
Avaza appears capable of meeting the requirements, but some responses recommended a lower plan without accounting for its limited number of timesheet users.
An eight-person agency would need an appropriate plan or additional user licences. The product might qualify while the calculation used to justify it was wrong.
Direct versus third-party integrations
Different responses used terms such as “native,” “direct” and “third-party automation” rather loosely.
A connection through Zapier or another automation service may still satisfy a general request for Xero integration. It should not automatically be described as a native integration.
These examples create an important distinction:
Recommendation frequency measures AI visibility. It does not prove that every recommendation is accurate.
A product still received visibility when AI Mode placed it in the shortlist, even if its price, plan or features were described incorrectly.
Could the testing process have encouraged convergence?
The testing conditions need to be acknowledged as a limitation.
The runs used the same Google account and browser environment over a relatively short period. Personalisation was turned off, but that does not guarantee that all 20 responses were completely independent observations.
Possible influences include:
- session continuity;
- temporary caching;
- recently retrieved sources;
- cookies or other session identifiers;
- clicking citations during the experiment;
- consistent language and location settings.
Google could potentially have reused or revisited sources retrieved during previous searches. That might have contributed to products reappearing.
However, there is no reason to believe that 20 searches from one user retrained the underlying model or taught Google globally to recommend these products.
The continuing changes also suggest that the results were not simply one cached answer:
- shortlist orders changed;
- different combinations appeared;
- products disappeared and later returned;
- Zoho Projects and Plutio appeared relatively late;
- supporting explanations and sources changed.
The safest conclusion is limited to what was observed:
Under these testing conditions, Google AI Mode converged around eight recommended products and strongly favoured a smaller core group.
The experiment does not prove that only eight suitable products exist or that another user would receive an identical distribution.
How many repeated searches were useful?
This experiment cannot establish a universal minimum for every AI visibility test.
It does provide a practical indication of what became visible at different stages.
One search
One response showed a single possible customer experience.
It could not distinguish persistent visibility from a one-off appearance.
Three searches
Three responses revealed meaningful variation and introduced five products.
This was enough to establish that the original shortlist was not fixed.
Five searches
Six of the eventual eight products had appeared. The main candidate pool was taking shape.
Ten searches
The hierarchy was clear enough to identify a persistent leader, a strong recurring alternative and several secondary products.
Ten runs produced a useful initial baseline.
Twenty searches
The additional runs identified two rare entrants, produced repeating shortlist combinations and showed the candidate pool beginning to level off.
The second ten added detail and confidence. They did not overturn the core pattern already visible after ten.
The practical lesson is not that every business must run every prompt exactly 20 times.
It is that some repetition is necessary before an isolated appearance can be interpreted as meaningful visibility.
Repeating a search now and repeating it later answer different questions
These 20 runs were conducted within a relatively short testing period.
They examined:
How much can the response vary under broadly similar current conditions, and which recommendations are consistently favoured?
Repeating the experiment after a longer interval will address another question:
Is the underlying recommendation pattern changing over time?
The web does not remain fixed. Between testing periods:
- product prices can change;
- plans and features can be updated;
- new pages can be published;
- existing sources can change or disappear;
- new competitors can enter the market;
- Google’s retrieval and synthesis systems can evolve.
Repeated sampling within one period helps reveal the current distribution. Repeating the complete test on later dates helps reveal movement in that distribution.
What happens next?
These 20 responses now provide a baseline.
I plan to reconvene the experiment after approximately one week and again after several weeks, using the same prompt and a consistent testing method.
The follow-up testing will examine whether:
- Teamwork retains its exceptionally high coverage;
- ClickUp remains the strongest recurring alternative;
- the same eight products continue to form the candidate pool;
- Zoho Projects and Plutio appear again;
- new products enter the recommendations;
- recommendation positions materially change;
- outdated prices or questionable feature claims are corrected.
If the distribution remains broadly similar, that would strengthen the evidence that the prompt leads AI Mode towards a genuinely limited candidate pool.
If the pattern changes, the differences may help reveal how quickly AI recommendation visibility can move.
Why this becomes difficult to manage manually
Twenty checks for one prompt were manageable as a focused experiment.
The workload changes considerably when applied across a business.
Monitoring:
- 25 important prompts;
- across three AI platforms;
- with ten repeated checks per prompt;
would create 750 individual responses in one testing cycle.
Each response may need to be opened, recorded and classified before its recommendations, positions and competitors can be compared.
Manual testing remains useful for:
- understanding how AI recommendations behave;
- investigating a small number of commercially important prompts;
- examining unexpected appearances;
- verifying automated monitoring results.
It becomes increasingly cumbersome when testing must cover many prompts, platforms and dates.
The purpose of automated monitoring is not merely to check one AI response more quickly. Its greater value is collecting enough observations to reveal patterns and then showing whether those patterns change.
Final conclusion
One Google AI Mode response showed three recommended products at one particular moment.
It could not show which products were consistently favoured.
That became visible only through repetition.
Within ten searches, a clear core had emerged. Teamwork appeared in every response, ClickUp established strong recurring visibility, and several alternatives rotated through the remaining positions.
The second set of ten searches uncovered two rare products and showed the wider pool beginning to level off. It added detail without overturning the original hierarchy.
This was a limited experiment conducted in one testing environment. It does not establish a universal number of required searches or prove that the candidate pool permanently contains only eight products.
It does demonstrate why one isolated check is insufficient:
A single response shows one possible result. Repeated testing begins to reveal the probability pattern behind it.
These 20 runs now provide a baseline. Repeating the experiment after one week and again after several weeks will show whether that underlying pattern persists—or whether the recommendation landscape has started to move.